


 27 / 85

page 27
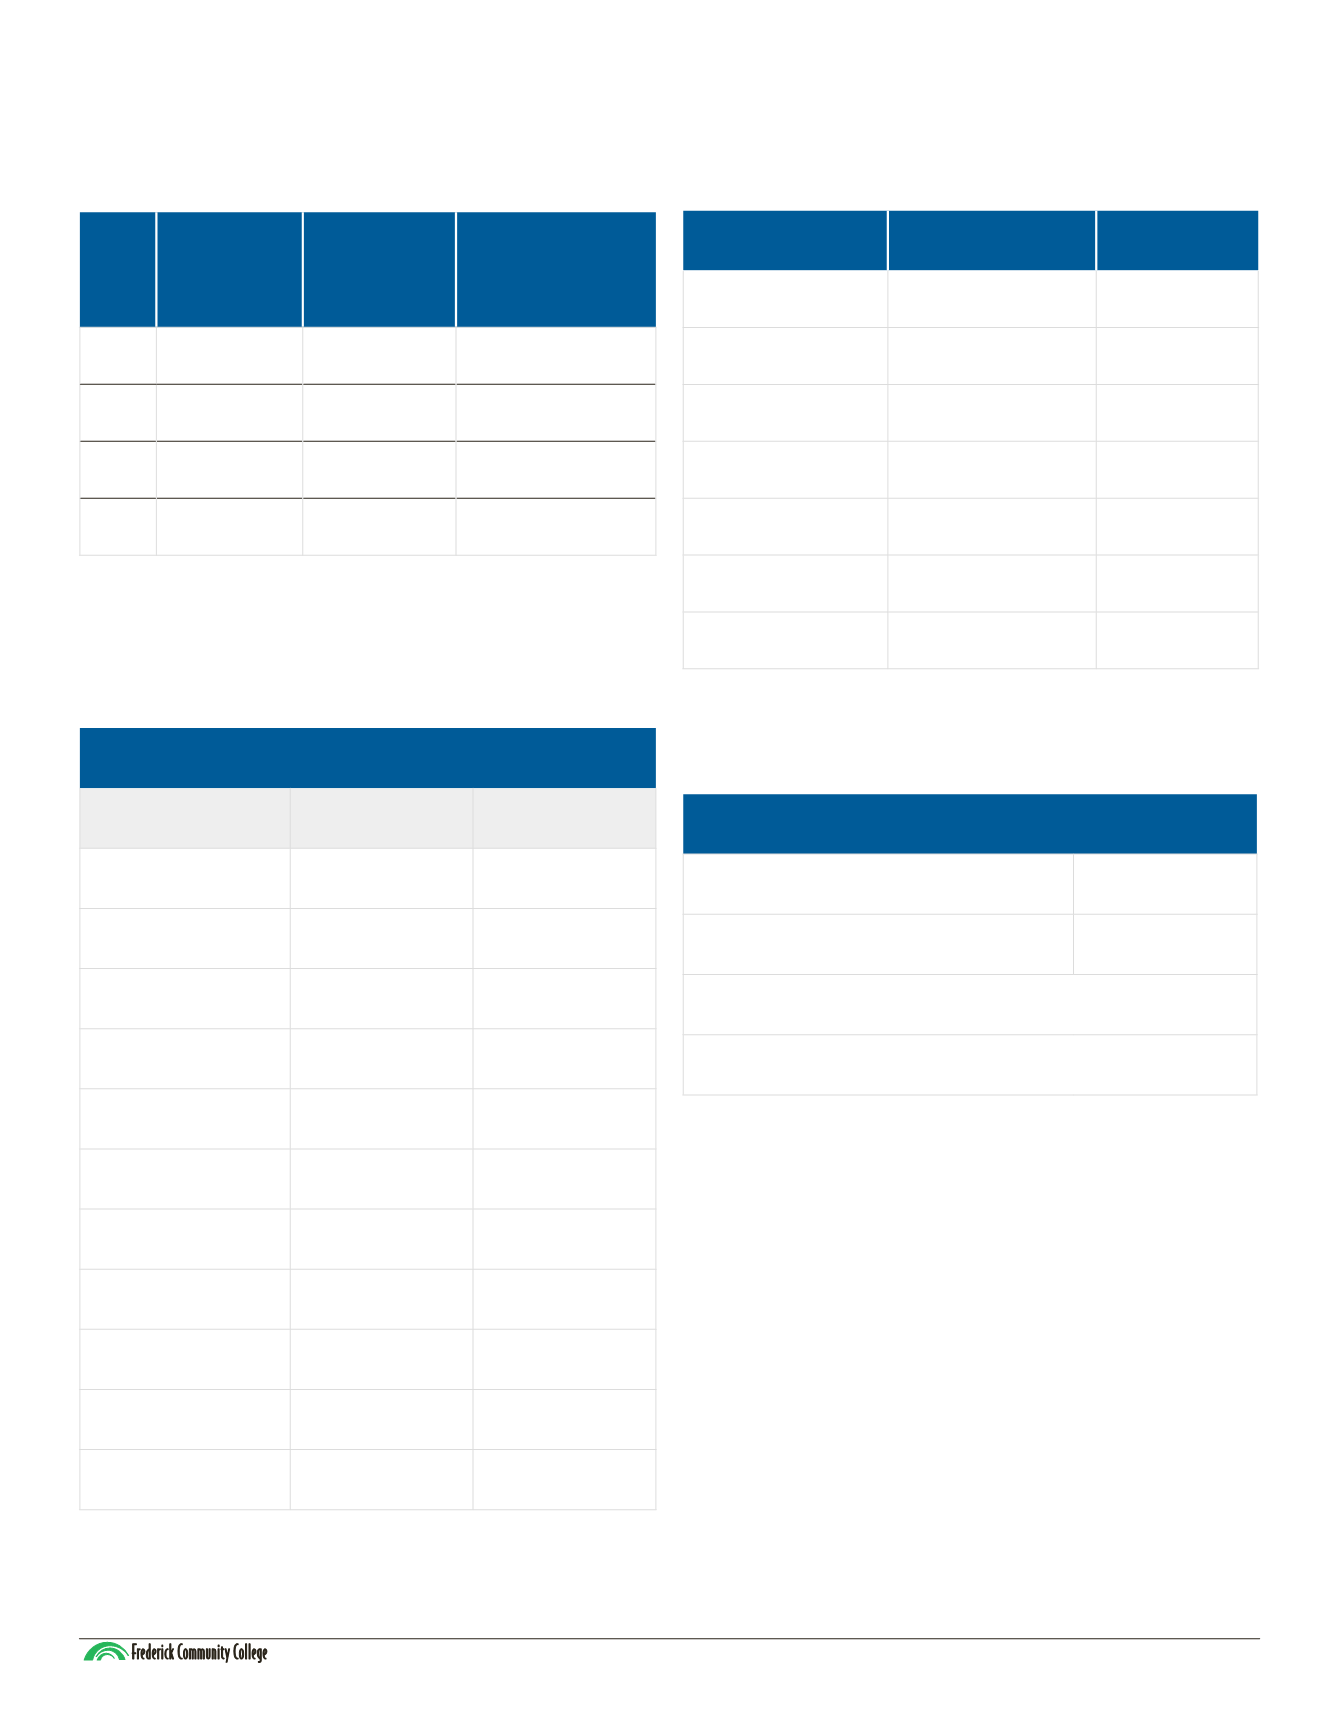
Percent Households
Distribution
Maryland
U.S.
Under $25,000
15.4
23.2
$25,00 - $49,999
17.9
23.7
$50,000 - $74,999
17.2
17.8
$75,000 - $99,999
13.4
12.2
$100,000 - $149,999
18.1
13.0
$150,000 - $199,999
8.9
5.1
$200,000 and over
9.1
5.0
Median household
$74,149
$53,482
Average household
$97,135
$74,596
Per capita
$36,670
$28,555
Total income (millions)
$209,422
$8,668,940
Income (2010-2014)
Households Population
Average Annual
Growth Rate
(Population)
2000 1,980,859
5,296,486
-
2010 2,156,425
5,773,552
.9%
2015 2,247,775*
6,006,401
.4%
2020 2,360,125*
6,224,550*
.4%
*Projections
Age
Number
Percent
Under 5
369,035
6.1
5 - 19
1,134,444
18.9
20 - 44
2,003,311
33.4
45 - 64
1,650,040
27.5
65 and over
849,571
14.1
Total
6,006,401
100.0
Median Age
38.4 years
Population and Households
Population Distribution (2015)
Educational Attainment – Age 25 & Over (2010-2014)
High school graduate or higher
89.6%
Bachelor's degree or higher
38.2%
1,445 Public Schools
1,423 Nonpublic Schools
Schools and Colleges
Maryland
Source:
http://commerce.maryland.gov/Documents/ResearchDocument/BriefEconomicFactsMaryland.pdfSource:
http://commerce.maryland.gov/Documents/ResearchDocument/BriefEconomicFactsMaryland.pdfSource:
http://commerce.maryland.gov/Documents/ResearchDocument/BriefEconomicFactsMaryland.pdfSource:
http://commerce.maryland.gov/Documents/ResearchDocument/BriefEconomicFactsMaryland.pdf